
How much running time does your machine have left? And what can we do to make it last longer?
Vibration analysis, thermography, laser shaft alignment and inspections for industrial rotating machinery. Online sensors, in-house software, on-site training and 20 years of field experience. Our engineers tell you what to do, when and how.
RUL · Remaining useful life
From each asset's trend we estimate when it will reach the alarm level. We don't give a magic date: we give a window to plan the replacement, with its confidence level, and our engineers confirm it with the spectrum.
- Fan motor35–41 days
- Mill gearbox90–120 days
- Compressor 02over 180 days
- Process pumpmore than 240 days
- A window, not a single date. We plan around the earliest date.
- No trend, no date. If the asset is not degrading, we don't make up a forecast.
- Engineers make the call. RUL sets the priorities; the diagnosis comes from the spectrum.
Illustrative example. RUL estimates when the overall-value trend crosses the threshold; it does not replace spectral analysis.
Does your machine have recurring failures? Do you want to increase its MTBF? We very likely have the solution.
Every critical case goes through our Engineering Board, backed by the PrediMan Atlas: the clinical registry of industrial equipment, built from 20 years in the field.
All our knowledge, applied to your machine from day one.
Let's work together on your remaining useful life indicators. How would you like to start?
Choose the option that best fits your plant. In every option, we handle the analysis, the reports and the remaining useful life of each machine ourselves.
With your plant staff
We send you a data collector and train your staff to collect data. From the analysis onwards, we take care of everything.
- Data collector shipped to your plant
- Staff training, online or on site
- Ideal for plants that have already run predictive maintenance with their own staff, or want a hybrid approach
With PrediMan staff
We handle everything: on-site measurement, analysis, reports and follow-up on every recommendation.
- PrediMan inspectors at your plant
- Monthly or custom routes
- Zero workload for your team
With the sensors you already have
We connect to your sensors, of any brand, without touching your WiFi network or your systems.
- Any sensor brand
- We don't touch your network or your systems
- Make the most of the investment you already made
No sensors: we install them
We install the sensors at no cost and only charge for the analysis. You get what matters: knowing the condition of your assets.
- Sensors installed at no cost
- You pay only for the analysis
- A report on every machine, every week
Valid for every option. We put sensors on your critical assets and you receive the weekly reports at no cost. When the trial ends, you decide whether to continue.
Receive it, install it, and we are already reporting on your asset.
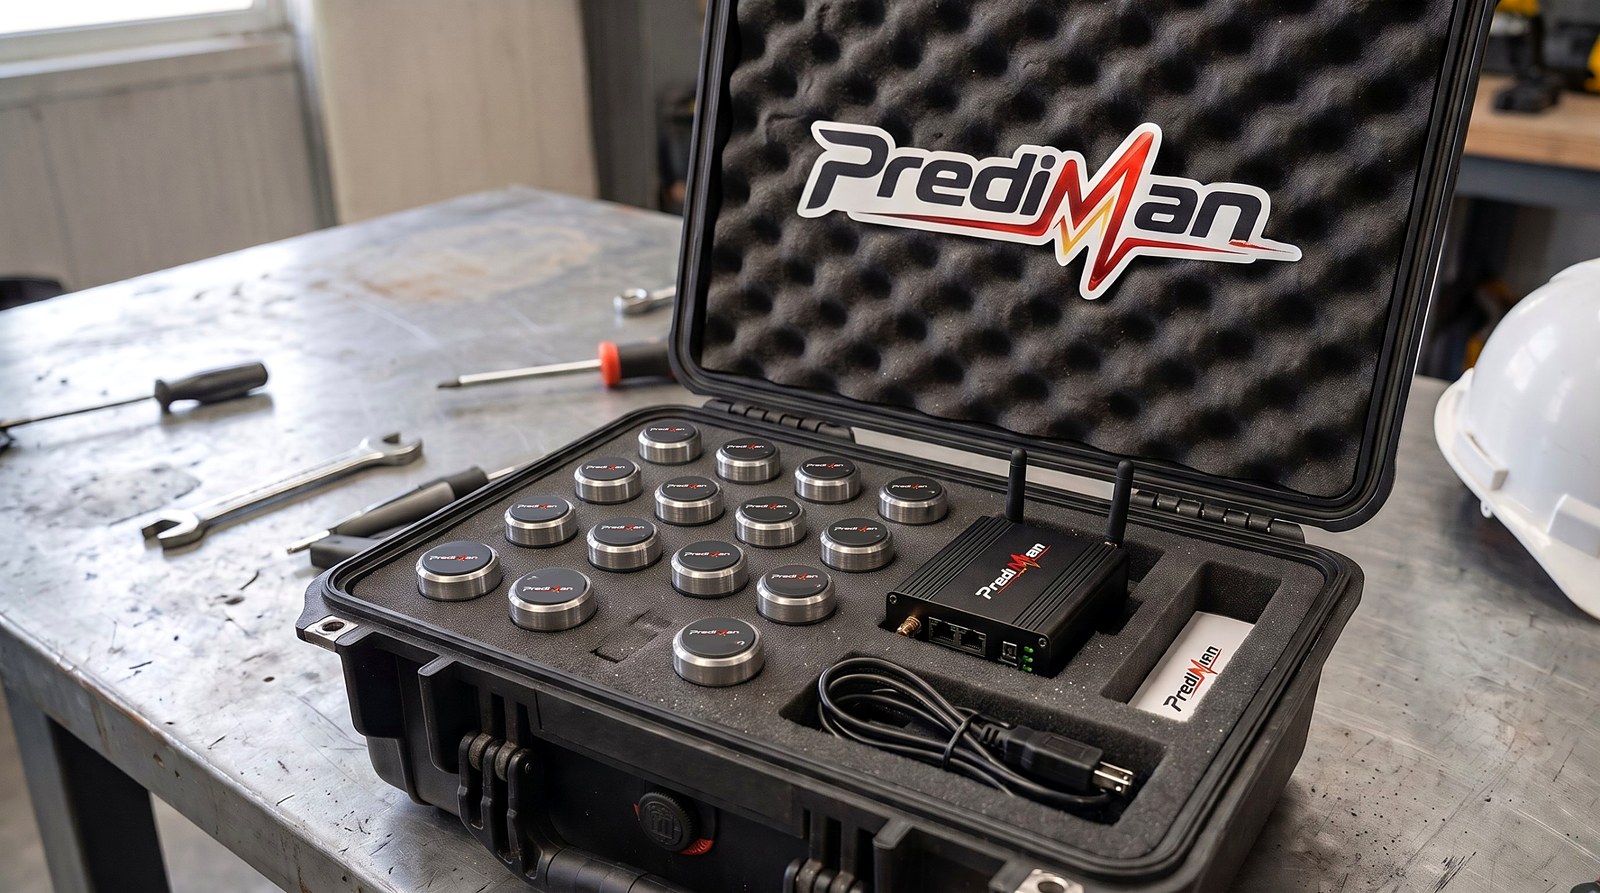
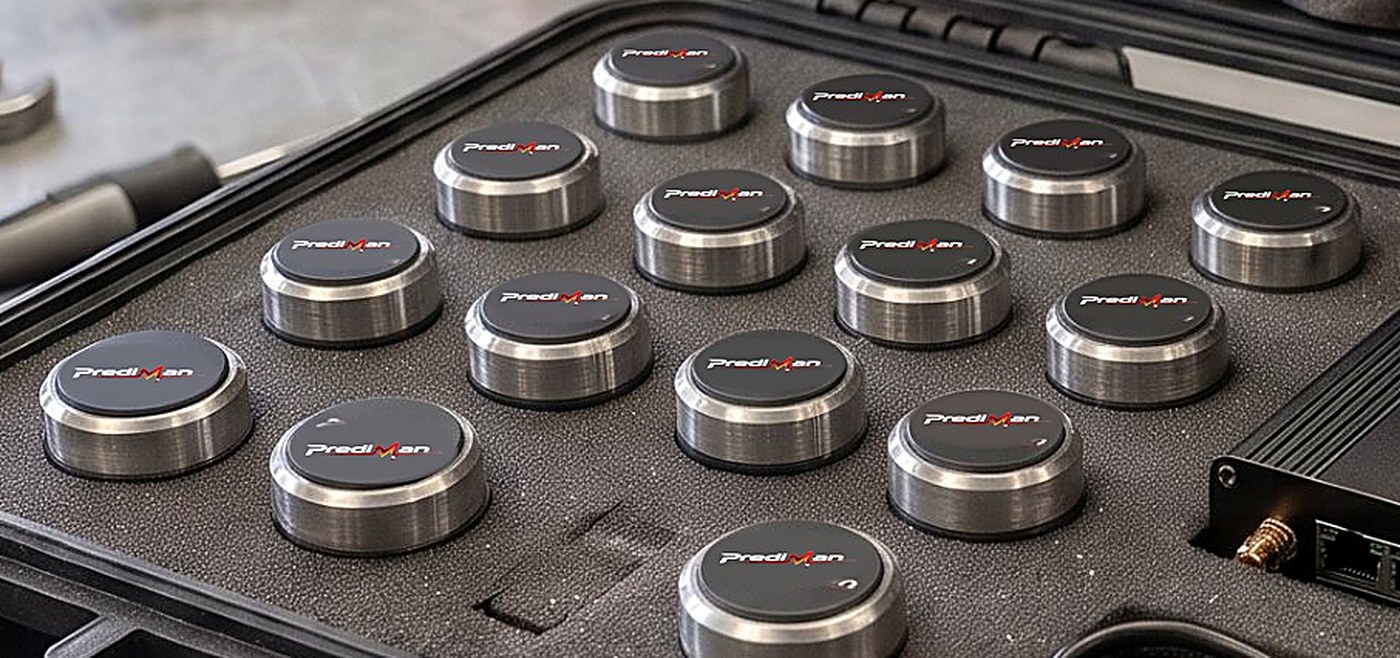
We send you a case with wireless sensors and our own gateway, already configured for your plant. You place them in minutes; we measure, analyze and send you an engineer's report.
Your maintenance, measured in hours and dollars
Plant, areas and the history record of each asset: current condition, failure mode matrix, condition history, interventions, recommendations and reports. And what management cares about most: how much predictive maintenance saved every month.
Every failure avoided, converted into hours and money
Every success is documented
When a recommendation is carried out and the asset returns to normal, we log it as a success story: what was detected, what was done, the before and after, and how much was avoided. With two ready-made presentations: a technical one for maintenance and one for management.
- Detection: bearing fault in the envelope spectrum, four weeks before the alarm.
- Intervention: bearing replacement planned for the scheduled shutdown.
- Result: 24 h of downtime avoided · USD 210,360.
Success stories feed the platform's savings indicators.
Reports that tell you what to do
Every asset gets its own report: condition, intervention priorities and the evidence behind them. The plant engineer reads it and the manager understands it.
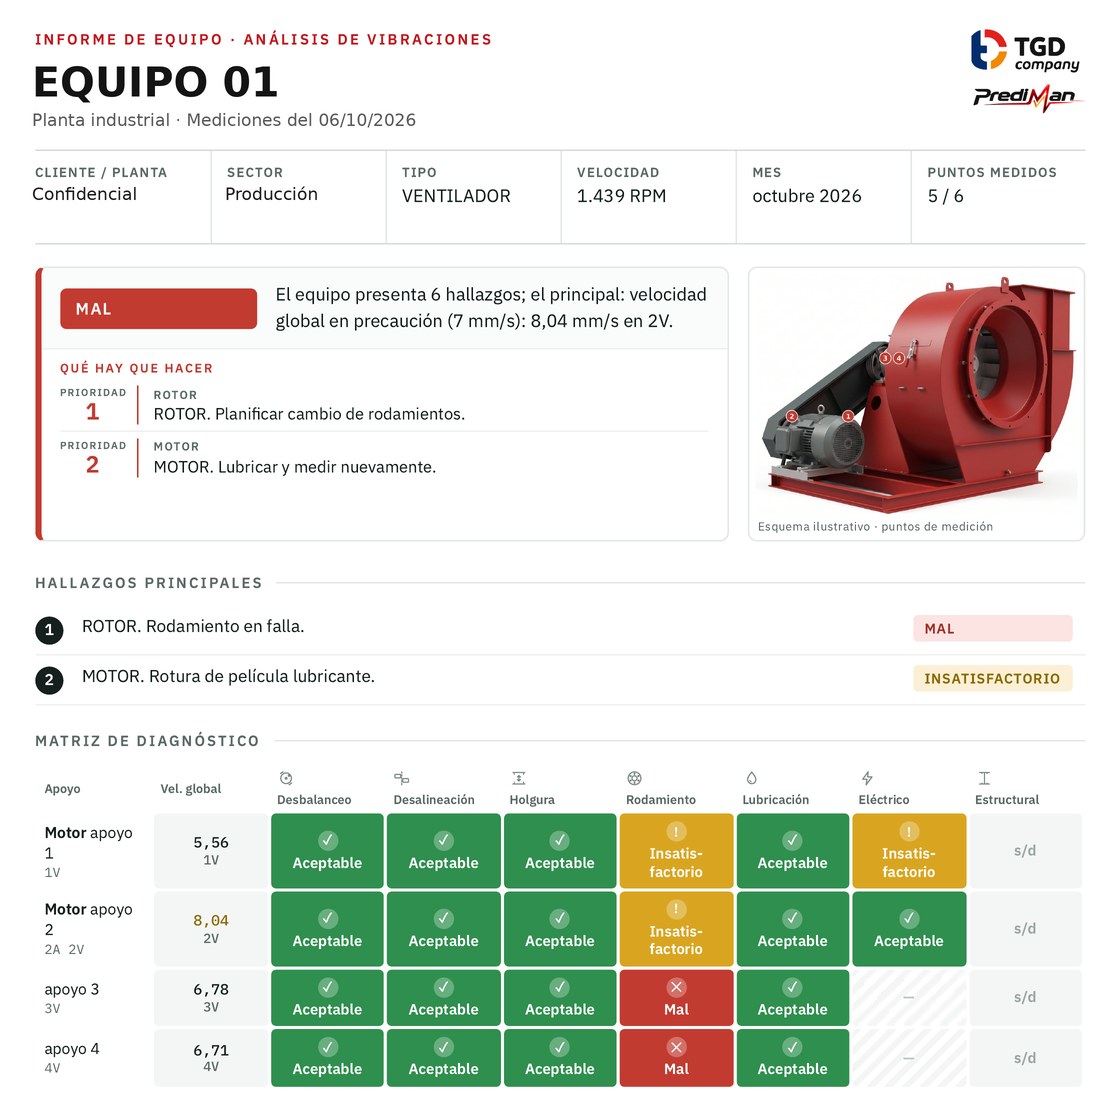
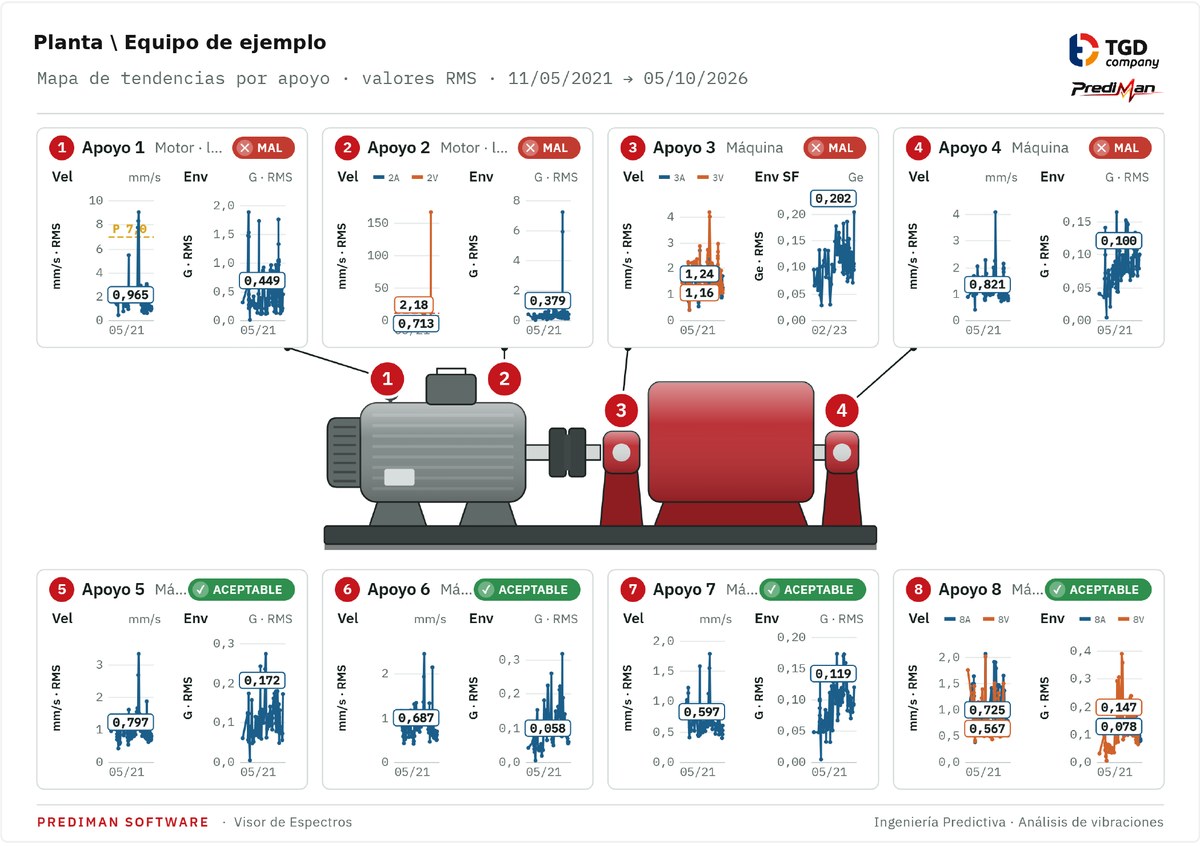
Real reports with client data hidden.
Services
Vibration analysis
Periodic routes with a data collector, spectra and waveforms. Diagnosis of bearing faults, unbalance, misalignment, looseness and electrical faults.
Thermography
Electrical panels, motors and mechanical components. Hot spots detected before they turn into a failure.
Visual inspections
Condition, lubrication and installation surveys. Everything is recorded in each asset's history.
24/7 online monitoring
Wireless sensors on critical assets and our own web platform. Details below.
Laser shaft alignment
Laser alignment of motors, pumps, fans and gearboxes. Less vibration, less wear on bearings and couplings.
On-site dynamic balancing
We balance fan, pump and motor rotors in place, without dismantling them. Less vibration, and the machine is back in production quickly.
Training online / on site
Courses for maintenance staff, supervisors and management, at your plant or remotely. Details below.
Engineering improvement proposals
When a failure keeps coming back, we find the root cause and propose the improvement: redesign, component changes or changes to operating conditions.
Engineering projects
Our more than 20 years of experience in the field, combined with the proactive approach of our engineers, allow us to take on engineering projects, structural calculations, finite element simulations and motion simulations, among others.
Your plant on your computer, tablet or phone
The maintenance manager sees the condition of every machine from anywhere. Here's how it works:
Illustrative screens with sample data.
Easy to understand
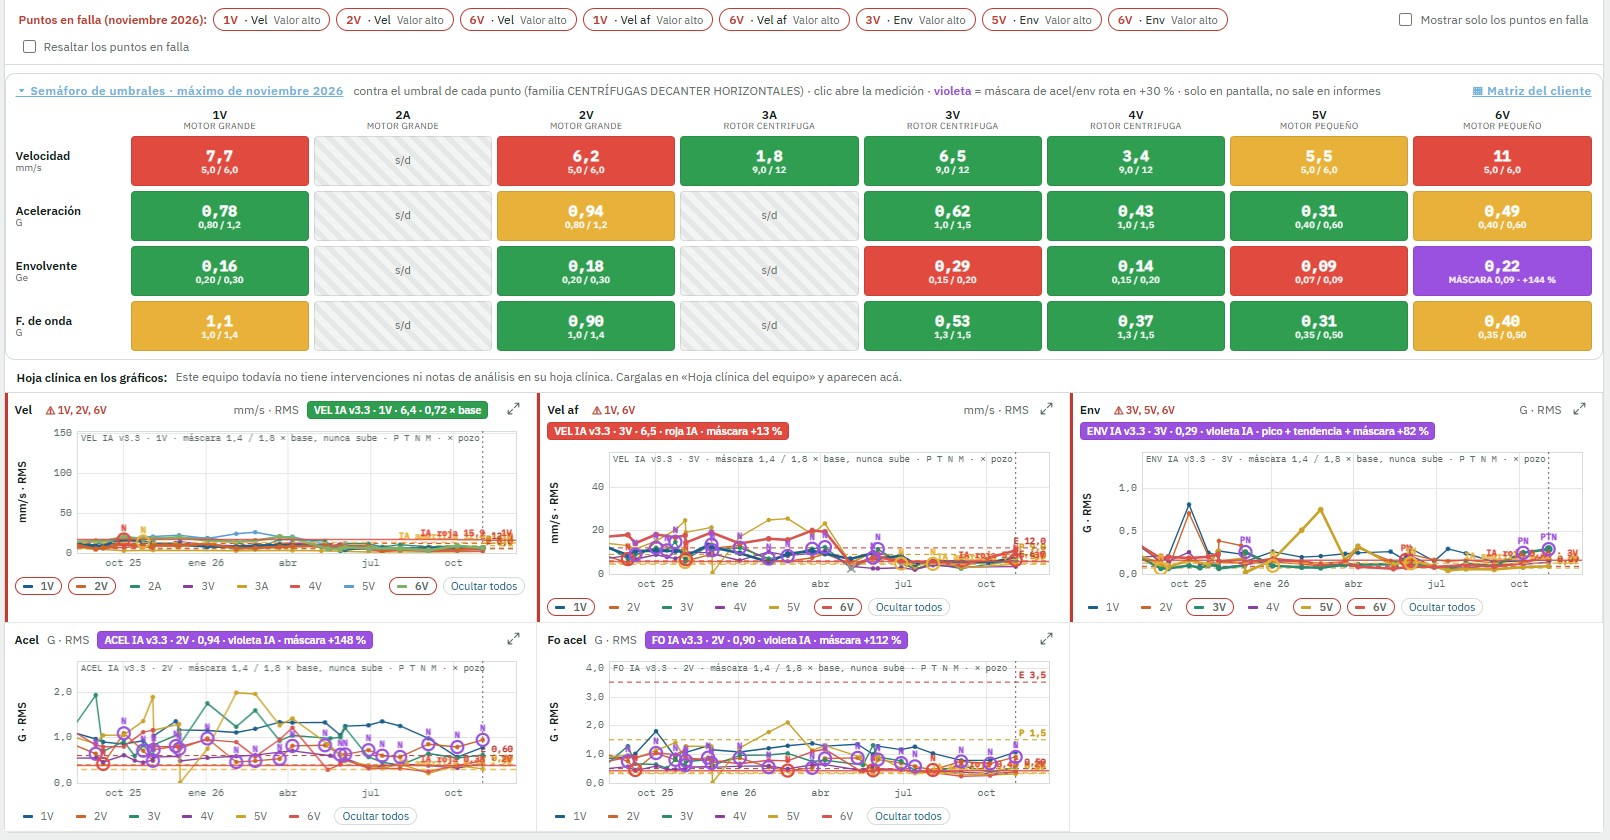
Your plant is shown in simple diagrams: at a glance you know which asset is fine, which is on alert and which needs intervention.
Tailored to your plant
Organize the view by plant, area or production line and follow only the assets that matter to you.
Everything in one place
Data collector measurements, online sensors, reports and interventions, brought together in a single platform.
To decide in time
Clear priorities and the remaining useful life of each asset, so shutdowns are planned with data, not intuition.
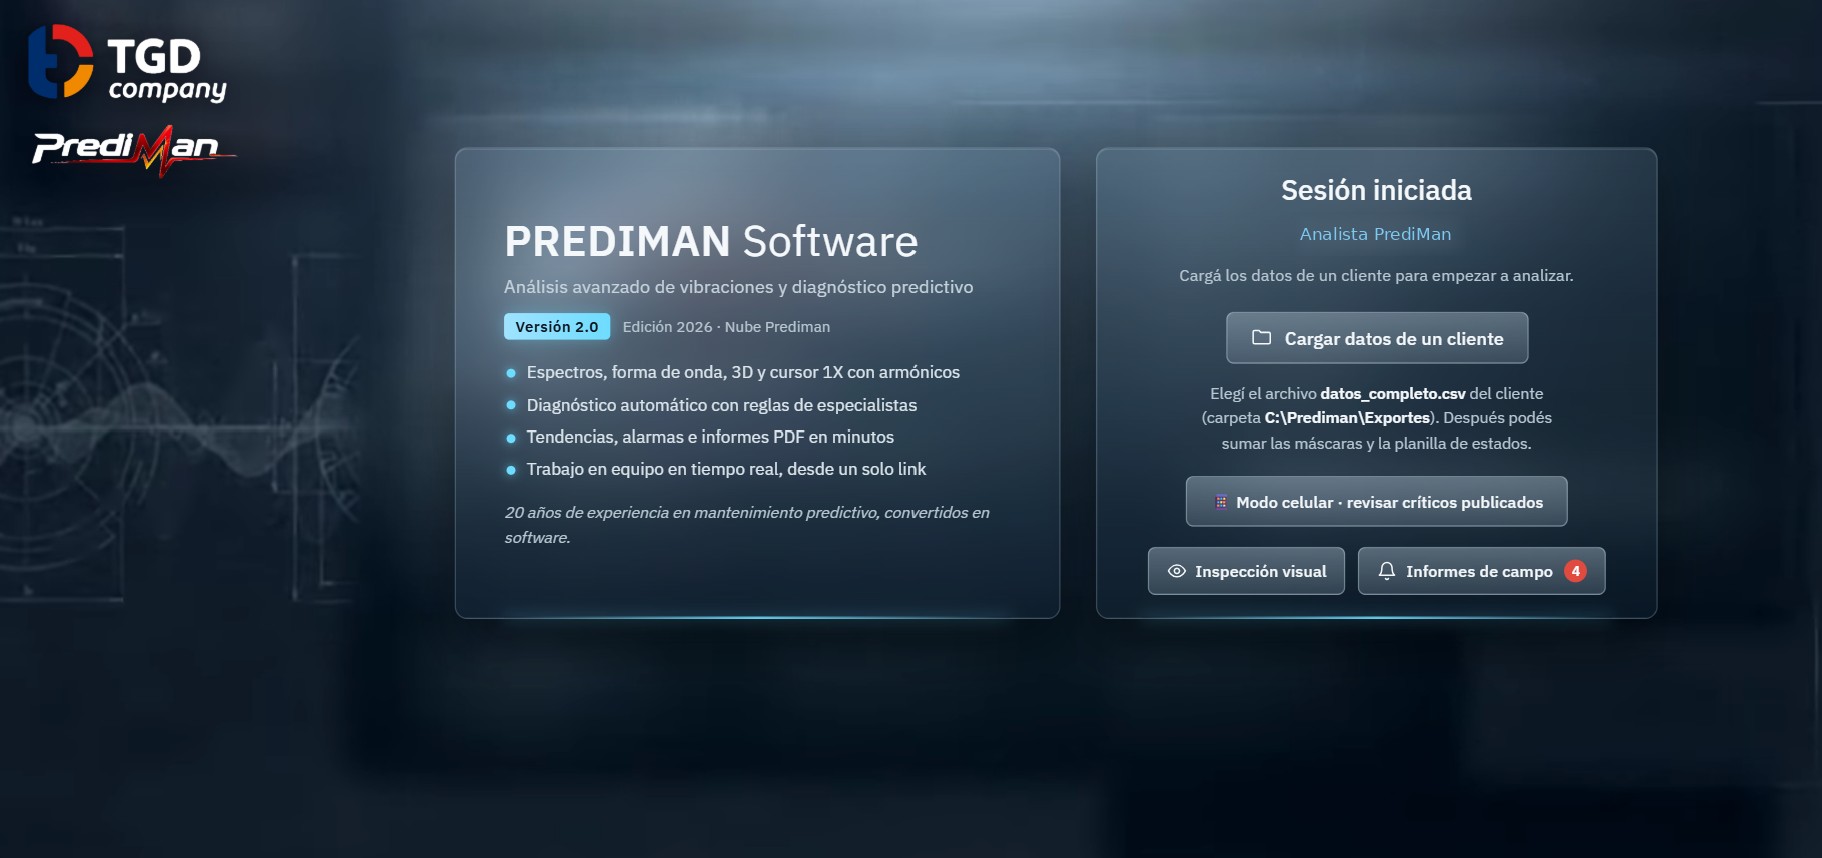
PrediMan Soft · Spectrum Viewer
It reads the databases from your current data collector and from our sensors, and brings them into a single analysis tool. Your years of history are not lost when you switch providers.
Reads any database
Whatever vibration software your plant uses today, our system reads it: data collector databases, CSV exports and online sensor data. 1 GB files load in seconds.
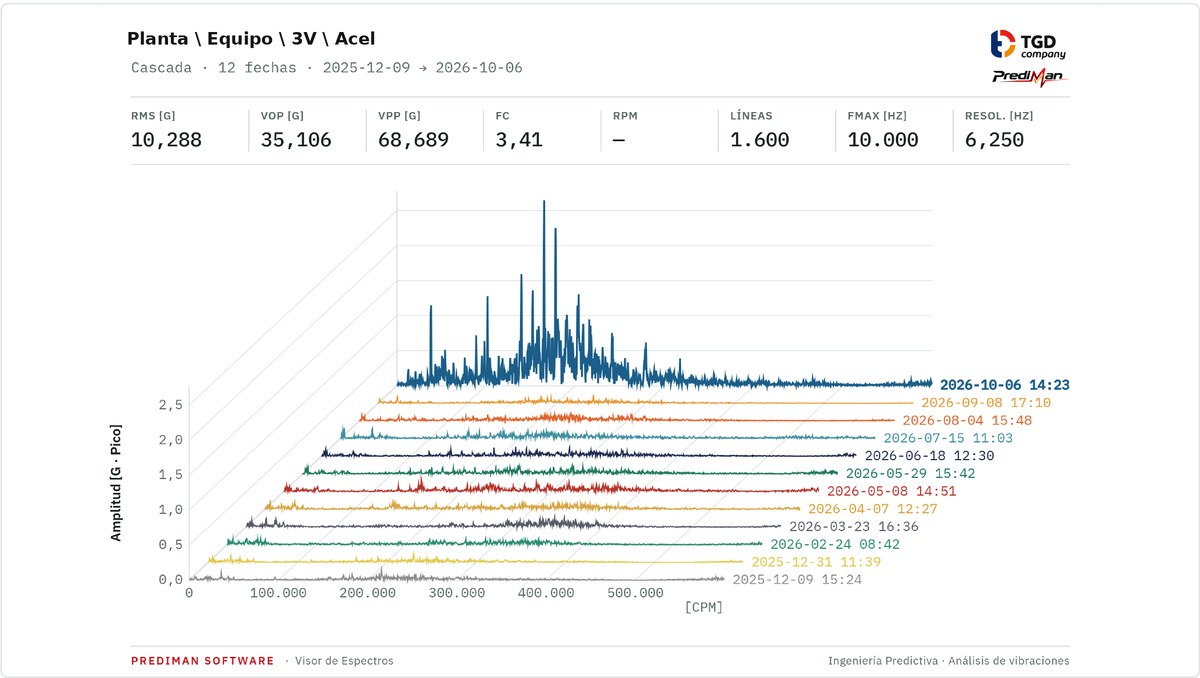
Spectra, waterfall and waveform
2D view and 3D waterfall, harmonics, peak spacing, Hz or CPM, peak or RMS, up to 4 overlaid dates.
Alarm masks and trends
Uses the collector's alarm masks and lets you edit them. Overall-value trends per point or for the whole machine.
Machine photo with points
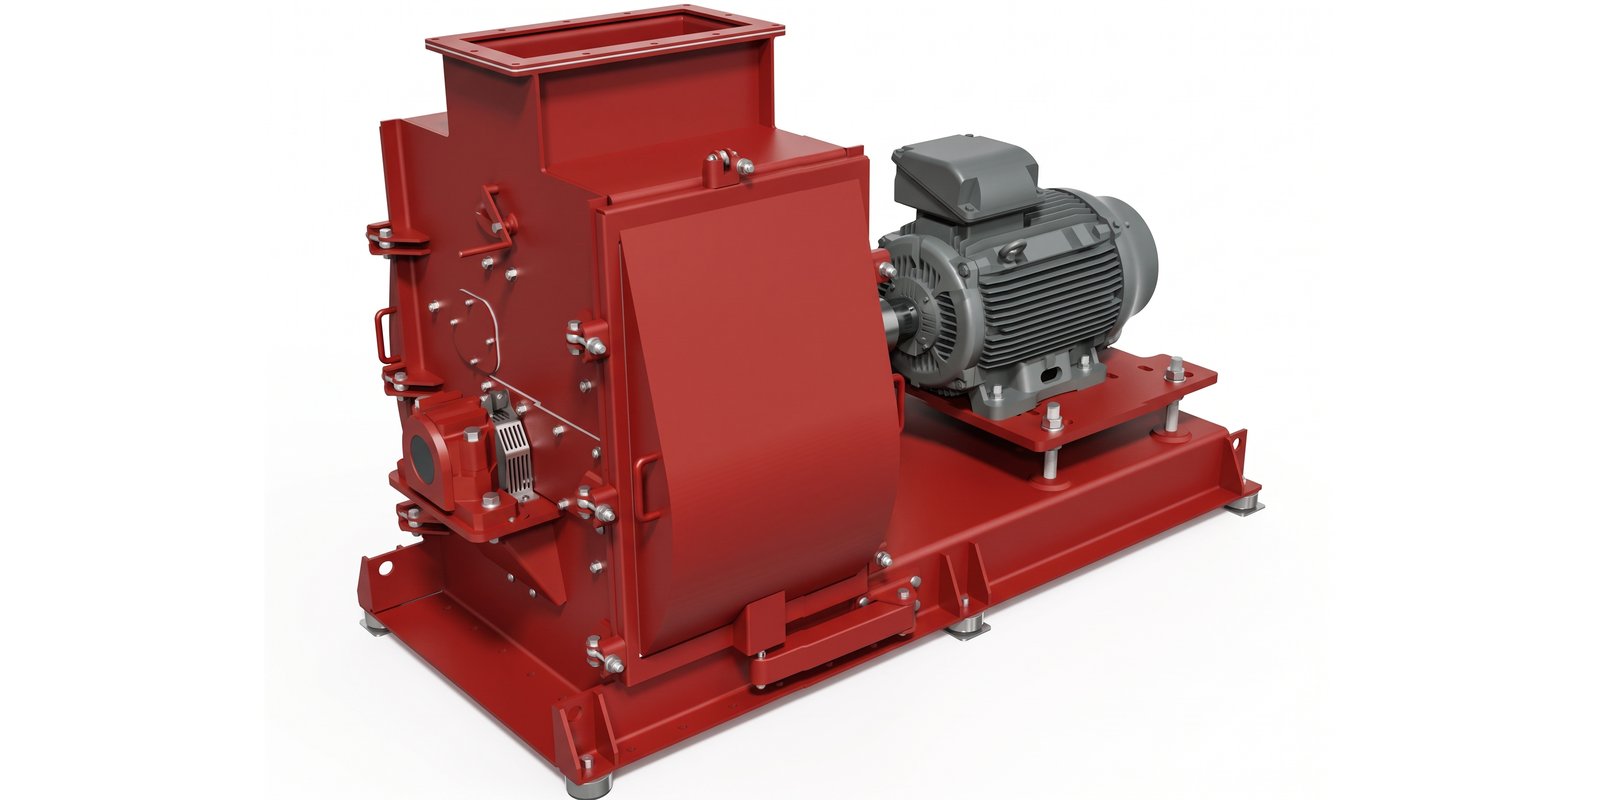
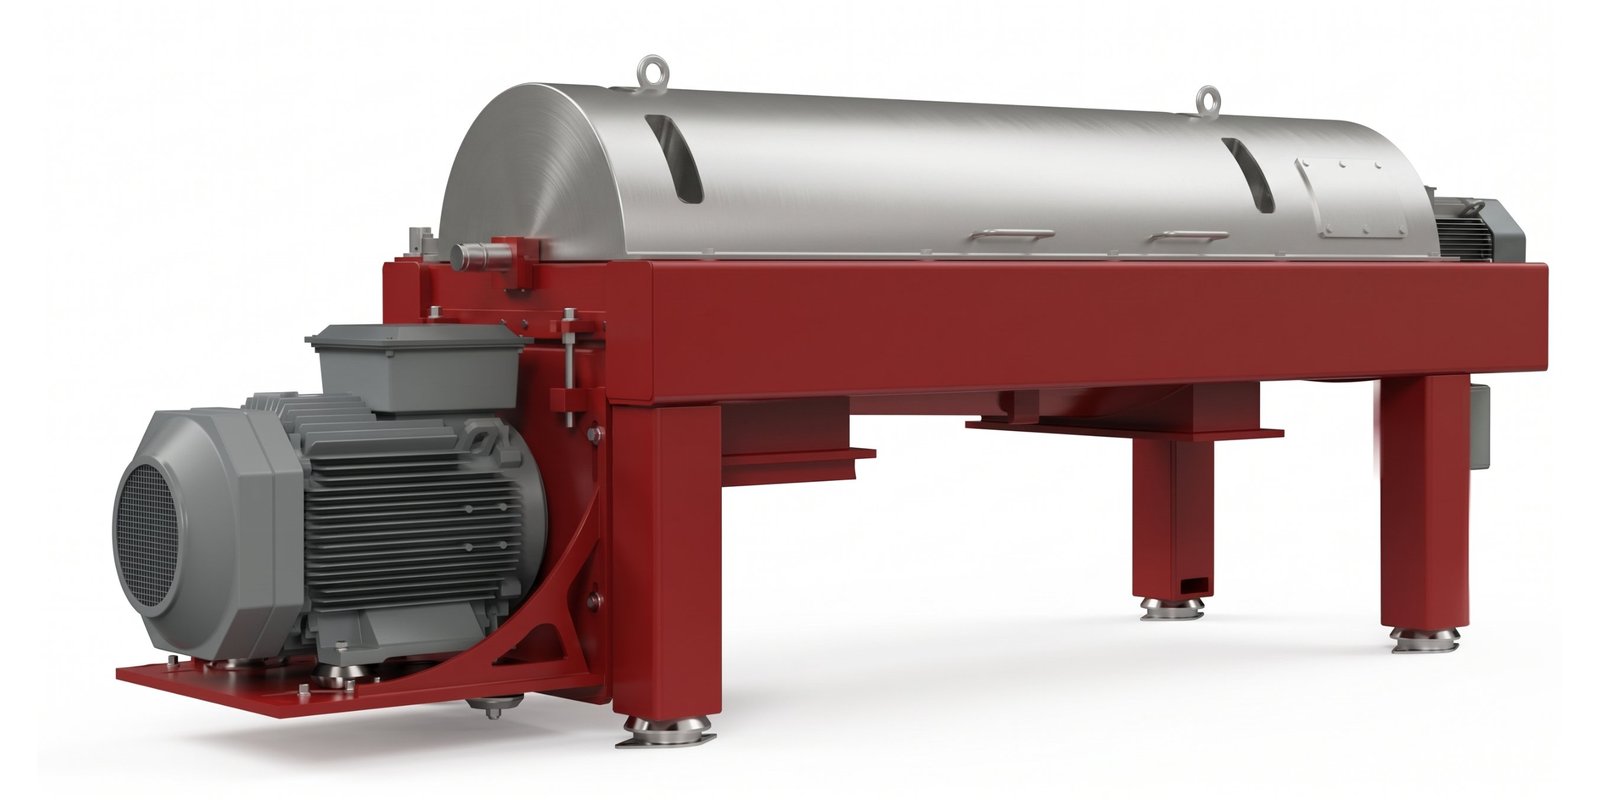
Every bearing marked on the actual photo of the machine, linked to its charts.
PDF report
Report for each machine with high-quality charts and diagnosis. When printed, the result is logged in the records spreadsheet.
Works offline
A single file that opens in the plant's browser. The data never leaves the computer.
At what point do you find out about the failure?
Every failure gives warning before it stops the plant. The difference is when you hear it. Without monitoring, most plants find out from noise or heat: too late, with an unplanned shutdown. With vibration analysis and online sensors, we detect it months earlier and you plan the repair.
The further left you detect the failure, the more time you have to act and the less the repair costs.
I want to detect earlierWe train your team at your own plant
Hands-on courses at your plant or online, taught by our engineers with 20 years of field experience. Less whiteboard, more machine: we work on your own equipment and with real failures we have found in industry. Your staff learns to detect early, intervene correctly and keep the failure from coming back.
Bearings: installation, lubrication and failures
How to install them, how to lubricate them and how to read a damaged bearing to find the cause.
Vibration for maintenance teams
What an analyst measures, what the condition levels mean and when to act.
Laser alignment and balancing
How laser alignment works, why a machine becomes unbalanced and how to keep it from happening again.
Thermography for panels and motors
What a thermal camera detects and how to prepare for the inspection.
Lubrication of rotating equipment
Quantity, frequency and common mistakes that shorten bearing life.
Results for management
How to present maintenance results to management: downtime hours avoided, dollars saved and success stories.
- At your plant or online, whichever suits you
- Content tailored to your equipment
- Hands-on practice with your machines
- For maintenance, supervisors and management
How we work
A cycle that doesn't end with the report: every intervention teaches us something, and we apply it to the next measurement.
We survey
We choose the critical assets together with you.
We measure
Routes with a data collector or online sensors.
We diagnose
Our engineers analyze trends and spectra.
We recommend
What to do, on which asset and when.
We feed back
We record what was done and how the machine responded. Every result fine-tunes thresholds and diagnoses.
We improve
We find the root cause so the failure doesn't return, and the cycle starts again, better every time.
The specialist for your machines
PrediMan is a team of mechanical engineers specialized in industrial vibration, with 20 years of field experience in predictive maintenance.
We don't sell you software and walk away: we follow each asset over time, like a specialist doctor who knows the patient's history.


- Municipalidad de
San Francisco 


We can send you references from each of our clients.
Let's start with your most critical machines
We suggest which assets to monitor, install the sensors and give you access to the platform.